Types of Networks & Connections & Devices
OSI / TCP-IP Layer Diagram (Planning & Design Requirement)
OSI/TCP-IP Diagram Explanation
This diagram shows how the seven layers of the OSI Model and the four layers of the TCP/IP Model relate to each other. It also helps explain where each of the activities in this unit occurs. Cable construction and testing happen at Layer 1 (Physical), ARP and MAC addressing occur at Layer 2 (Data Link), IP addressing and routing operate at Layer 3 (Network), and traceroute and ping testing also rely on Layer 3. The web server activity operates at Layer 7 (Application). Understanding these layers made it easier to see how every part of the labs connects together into one working network system.
Lesson 1 - Exploring IP Adresses
Answer the following in complete sentences in a well-written paragraph on your digital porfolio:
- Are your internal and external IP addresses the same or different?
- Which IP belongs to your local network?
- Which IP belongs to the internet?
- Why might a virtual machine use Network Address Translation (NAT) when connecting to the internet?
- How does Shared mode make it easier to connect multiple virtual machines on one computer?
The internal and external IP addresses are different. The internal IP belongs to the local network and identifies the virtual machine inside a home or school network. The external IP belongs to the internet and is assigned by the internet provider. A virtual machine uses Network Address Translation (NAT) to share the host computer’s internet connection, which helps it go online without needing its own public IP. Shared mode makes it easier to connect multiple virtual machines on one computer because they can all use the same internet connection safely and easily.
The output of ip a in Shared (NAT) mode
The output of ip a in Bridged mode
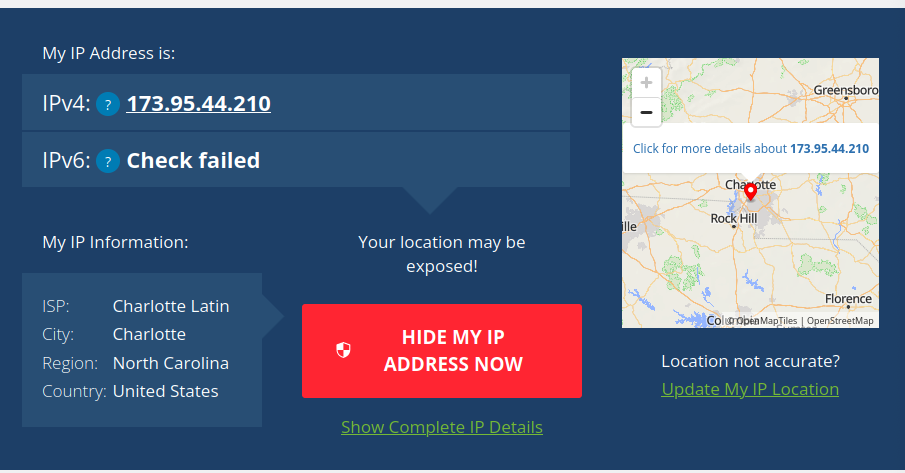
The WhatIsMyIPAddress.com page results for both modes
whatismyipdress.com IPv4 Shared Mode
whatismyipdress.com IPv4 Bridged Mode
.png)
Answer the following in complete sentences in a well-written paragraph on your digital
portfolio:
- How did your internal IP address change when you switched to Bridged mode?
- Did your external IP address change or remain the same?
- In Bridged mode, does your virtual machine act more like a separate computer or a computer behind another device?
- Why might an organization choose Bridged mode instead of Shared (NAT) mode?
- What security or management challenges could come with using Bridged mode?
When it was switched to Bridged mode, the internal IP address changed from 192.168.64.2 to 10.32.1.32, showing that the VM joined a new part of the local network. The external IP stayed the same because both modes used the same internet provider. In Bridged mode, the VM acts more like a separate computer on the network instead of being hidden behind the host. An organization might use Bridged mode to let virtual machines communicate directly with other devices. However, it can be less secure because each VM is fully visible on the network.
| Mode | Internal (Private) IP | External (Public) IP | Notes |
|---|---|---|---|
| Shared(NAT) | 192.168.64.2/24 | 173.95.44.210 | The Internal and Extrenal are different but the external for bridged and shared are the same |
| Bridged | 10.32.1.32/23 | 173.95.44.210 | internal and external are very different |
Write a short paragraph (5–7 sentences) beneath your table addressing the following:
• Which mode made your VM appear as its own device on the local network? • Which mode provided a safer, more controlled environment? • How does NAT help manage limited IPv4 addresses and improve security? • What did you learn about how data travels from a device to the internet?
Bridged mode made the VM appear as its own device on the network. Shared (NAT) mode provided a safer, more controlled setup because it hides the VM behind the host computer. NAT helps save IPv4 addresses by letting many devices share one public IP while keeping their private addresses separate. It also adds security by blocking outside access. Data travels from a local device through the router (and sometimes NAT) before reaching the internet and coming back to the right device.
Write a short reflection (1 paragraph, 5–8 sentences) below your screenshots that answers these:
• How did your IP addresses change between Shared and Bridged mode? • What did this experiment teach you about how local and public networks communicate? • Why might IT professionals use different network configurations for home, business, or lab environments? • Which mode do you think is best for classroom use, and why?
When switching between Shared and Bridged mode, the internal IP changed, but the external IP stayed the same. This showed how local and public networks work together through routers and IP translation. IT professionals use different network setups for safety, testing, or direct access. For classroom use, Shared (NAT) mode is better because it’s safer and easier to manage. This activity taught how devices connect to each other and the internet.
Lesson 2 — Network Topologies
Part 1: Topology Diagrams
Star Topology
Description:
A central device (switch or hub) sits in the middle, and all computers connect directly to it. This structure makes it easy to manage, expand, and troubleshoot.
Screenshot:
Bus Topology
Description:
A single main cable, known as the backbone, runs horizontally with each device branching off using a short perpendicular connection. All devices share the same communication line.
Screenshot:
Ring Topology
Description:
All devices form a closed loop, with each device connected to two neighboring devices. Data travels around the ring in one direction, or in both directions in a dual-ring setup.
Screenshot:
Mesh Topology
Description:
Every device connects to multiple others, creating multiple data paths throughout the network. This design offers high redundancy and excellent reliability.
Screenshot:
Hybrid Topology
Description:
A combination of two or more topology types. An example is several star networks connected together through a bus or ring structure, providing both flexibility and scalability.
Screenshot:
Reflection Paragraph
The easiest topology to set up for a small business is the star topology because it requires only one central switch and simple point-to-point connections, making it straightforward to install and maintain. The most reliable topology when a single connection fails is the mesh topology since it provides multiple paths for data, allowing communication to continue even if one link goes down. The most expensive topology to implement is also the mesh topology due to the large number of cables and connections needed to link every device to multiple others. Charlotte Latin school most likely uses a hybrid topology because large organizations typically combine multiple star networks or other configurations to support different buildings, departments, and floors while maintaining speed and reliability. The physical layout of a topology affects network performance because shorter, more direct paths reduce congestion and improve speed, while redundant layouts improve reliability by ensuring that data can still travel even if a cable or device fails. Overall, the topology chosen has a major impact on cost, speed, scalability, and reliability in any network environment.
Lesson 3 - Cable Constructing and Testing
Part 1: Required Photos and Videos
Photo #1 — Stripped Cable (Four Twisted Pairs Visible)
Photo #2 — Wires Arranged in T568B Order
Photo #3 — Wires Inserted Into RJ45 Connector (Before Crimping)
Photo #4 — Completed Cable Ends (Both Sides)
Video #1 — Stripping Demonstration
Photo #5 — Cable Tester Results
Video #2 — Cable Testing Demonstration
Photo #6 — T568A vs T568B Comparison
Part 2: Reflection Paragraph
The most challenging step in creating the Ethernet cable was arranging the wires neatly in the correct T568B order, because keeping the pairs straight, flat, and aligned while preventing them from springing out of place required patience and precision. Maintaining the correct wire order is critical for network reliability because Ethernet communication depends on specific pins handling transmit and receive signals; even a single misordered wire can cause signal loss, failed connections, or reduced performance. This hands-on process directly connects to the Physical Layer (Layer 1) of the OSI Model, which is responsible for transmitting electrical signals through copper wires, and building the cable showed how the physical medium determines whether those signals can travel correctly. If a cable were built incorrectly but never tested, a real network could experience intermittent failures, slow speeds, or complete device disconnection, leading to troubleshooting delays and unnecessary equipment replacement. Labeling the cable and using professional tools mirrored real-world industry standards, where technicians must ensure accuracy, durability, and traceability of every cable before installation. This process demonstrated how careful construction, proper testing, and clear labeling form the foundation of reliable network infrastructure.
Lesson 4 - Network Interface & OSI Layer Lab Report
Screenshot 1: ip link show
Recorded Info
- Interface name: enp0s1
- MAC address: 1a:63:23:39:a4:2c
- Broadcast address: ff:ff:ff:ff:ff:ff
Explanation
The ip link show command lists all network interfaces on the Ubuntu VM. The active interface, enp0s1, is the virtual network card. The MAC address uniquely identifies the VM’s network interface on the local network, while the broadcast address is used to send data to all devices on the same LAN.
Screenshot 2: arp -n
Explanation
The arp -n command displays the ARP (Address Resolution Protocol) table, which maps IP addresses to MAC addresses. Each entry represents a device the VM has recently communicated with. ARP helps the computer determine which MAC address corresponds to which IP address so data can be correctly delivered on the local network.
Screenshot 3: ip -s link or sudo ethtool enp0s1
Explanation
This command shows how many packets have been sent (TX) and received (RX) on the active interface. It may also include error counts, connection speed, and duplex mode. The results indicated a 1000Mb/s full-duplex connection, meaning data can flow both directions simultaneously. The packet counts show how active the VM’s network connection has been.
Screenshot 4: sudo tcpdump -c 5
Explanation
This command captured five packets of live network traffic. Each packet displays a source MAC address (sender) and a destination MAC address (receiver). The captured traffic included ARP and IP packets, showing that the VM was exchanging basic network information and possibly ping responses. This demonstrates how data physically moves between devices at OSI Layers 1 and 2.
Reflection
This lab taught how the Ubuntu VM communicates on the network using its interface and MAC address. The MAC address acts as a permanent hardware identifier, while the IP address can change and is used at a higher layer for routing. ARP links these two systems by mapping IP addresses (Layer 3) to MAC addresses (Layer 2), allowing the VM to send frames to the correct device on the local network.
Viewing live packets with tcpdump allowed viewing of actual frames being transmitted, including source and destination addressing. This clarified how the Physical Layer (Layer 1) transmits raw bits while the Data Link Layer (Layer 2) frames those bits and ensures they reach the correct destination. Together, they form the foundation for all network communication.
What Was Learned About OSI Layers 1 & 2
Layers 1 and 2 work together to enable reliable communication between devices:
- Layer 1 – Physical Layer: Handles the actual transmission of bits through electrical signals over cables or wireless frequencies.
- Layer 2 – Data Link Layer: Packages data into frames and uses MAC addresses to deliver data to the correct device on a local network.
Commands such as ip link show, ethtool, and tcpdump provided insight into what happens beneath the surface when connecting to the internet. Understanding these layers is essential for troubleshooting, network setup, and recognizing how data moves from one device to another.
Leson 5 - Building and Testing a SOHO Network
Part 1: SOHO Network Diagram
Network Explanation
This SOHO network is designed to balance reliability, organization, and realistic device placement using the 192.168.50.0/24 addressing scheme. The router serves as the gateway for all devices and holds the static address 192.168.50.1, while the switch expands the number of wired ports for the Ubuntu computers, printer, and NAS. The access point provides wireless coverage for mobile devices like the smartphone, tablet, and IoT device. The printer and NAS use static IP addresses so they remain easy to locate on the network, while the computers and wireless devices receive their addresses automatically through DHCP. Each connection was chosen to reflect real-world setups: wired links for stationary and bandwidth-intensive devices, and wireless links for mobile or convenience-based devices. This design creates a stable, organized, and scalable SOHO network that mirrors those used in homes and small offices.
Part 2: Ubuntu Network Simulation
Screenshot #1 — Partner IP Addresses
Screenshot #2 — Successful Ping Results
Part 3: Network Diagnostic Commands
Explanation
These diagnostic commands reveal how devices communicate across the SOHO network. The arp -a command shows nearby devices and their MAC addresses, demonstrating how Layer 2 handles local communication. The netstat -r command reveals the routing table, showing how data chooses its path according to Layer 3. Commands like traceroute show how packets travel across multiple networks, reinforcing how routing decisions move data beyond the local network.
Part 4: Firewall Configuration
Screenshot — Firewall Status (ufw active)
Firewall Explanation
Enabling the firewall protects the system by filtering incoming network traffic, allowing only trusted or permitted connections. This prevents unauthorized access and adds a layer of security to the SOHO network.
Part 5: Traceroute Results
Screenshot — Traceroute Output
Traceroute Summary
The traceroute output shows the number of hops and routers the packets travel through before reaching the destination. This demonstrates how data moves across multiple networks, even for a simple request, and highlights how routing devices guide traffic through the internet.
Part 6: Application Layer Activity — Simple Web Server
Screenshot — Web Browser Showing Shared Files
“This demonstrates the Application Layer by showing how one device can serve files to another over HTTP.”
Reflection Paragraph
This lesson demonstrated how devices communicate on a network by allowing guiding the design a complete SOHO layout and then test real connectivity using Ubuntu virtual machines. OSI Layers 1 through 3 were actively involved throughout the lab: Layer 1 handled the physical and wireless connections, Layer 2 managed MAC addressing and local communication shown through commands like arp -a, and Layer 3 controlled IP routing, visible in the routing table and the path traced by traceroute. Enabling the firewall reinforced how security controls filter traffic and protect systems from unauthorized access. The traceroute results were especially surprising because they revealed how many routers and networks the data travels through before reaching something as simple as Google. The web server activity demonstrated how real websites operate, with one device hosting content and another accessing it through an HTTP request. If this were a own home network, there should be an additional access point for stronger coverage, set more static IPs for critical devices, and implement stronger firewall rules to improve reliability and security.
Final Reflection
This entire unit helped clarified understand how all parts of a network fit together, from the physical cable to the application layer. IP addressing labs showed the difference between private and public networks and how NAT protects devices while sharing a single public IP. The topology drawings taught how different network layouts affect cost, speed, reliability, and scalability. Building and testing the own Ethernet cable connected directly to OSI Layer 1 and helped see how physical signals support everything above them. The OSI Layer 1–2 lab helped analyze MAC addresses, frames, and packet flow, giving a clearer picture of how devices talk on the local network. The SOHO network project brought everything together by requiring a full design, device addressing, security settings, routing analysis, and even an application-layer web server. Altogether, these lessons helped understand how networks function from the cable all the way up to the applications people use every day.